UMW 2022-2023 Grade Distribution Summary Report
The Trends
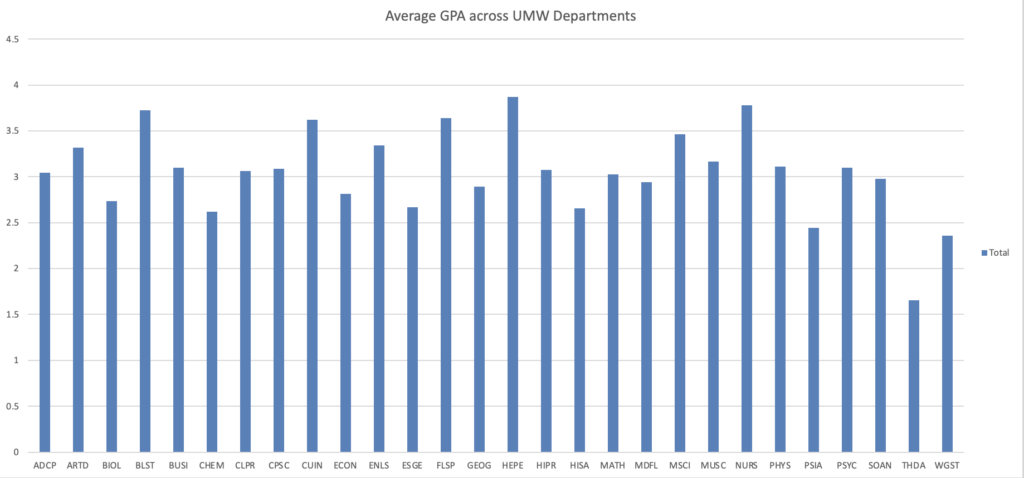
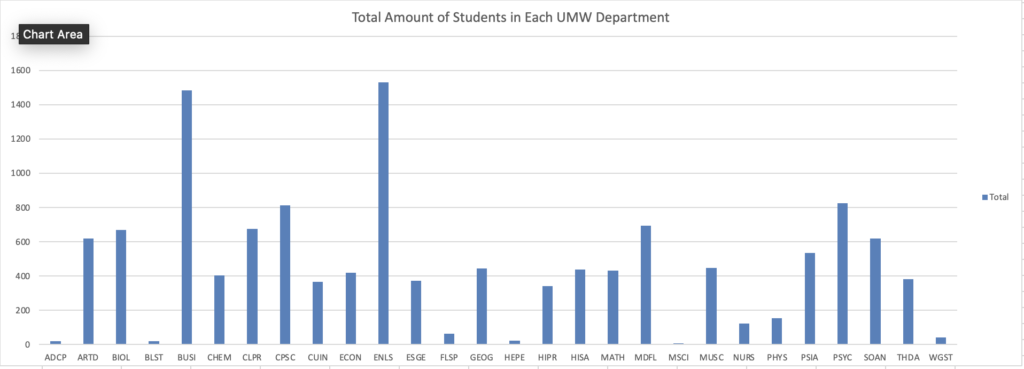
I chose to focus specifically on the average of the GPA’s of each department at UMW. I found that the departments such as HEPE, NURS, and BLST had the highest average GPA, while departments such as THDA, PSIA, and WGST having the lowest average GPA. The most prominent trend that I could identify was that the departments with the least amount of students would have the highest grade point averages. This could be due to how the average of the the departments with the lowest amount of students are calculated differently to those with a higher amount of students. Another trend is that the departments that are more science-based have a lower average gpa possibly due to the intense curriculum.
The Process
I can admit I do not have a lot of experience at all with spreadsheets. I found any videos, specifically Professor Berge’s video on how to use Microsoft Excel, very helpful, as they explained thoroughly how to accurately analyze data using Excel. I used Microsoft Excel in order to create the data sheet. It made it easy in order to clean up any data that I did not need or anything that wouldn’t be relevant to the trend that I identified. I found the data that I used on the UMW’s site for Institutional Analysis and Effectiveness. They have all the grade distribution summaries dating back to 2017, even including the years during COVID. I specifically used the 2022-2023 Grade Report, as I thought it would be interesting to analyze since those were the years that COVID cases were lowering, and things could go back to normal.
Leave a Reply